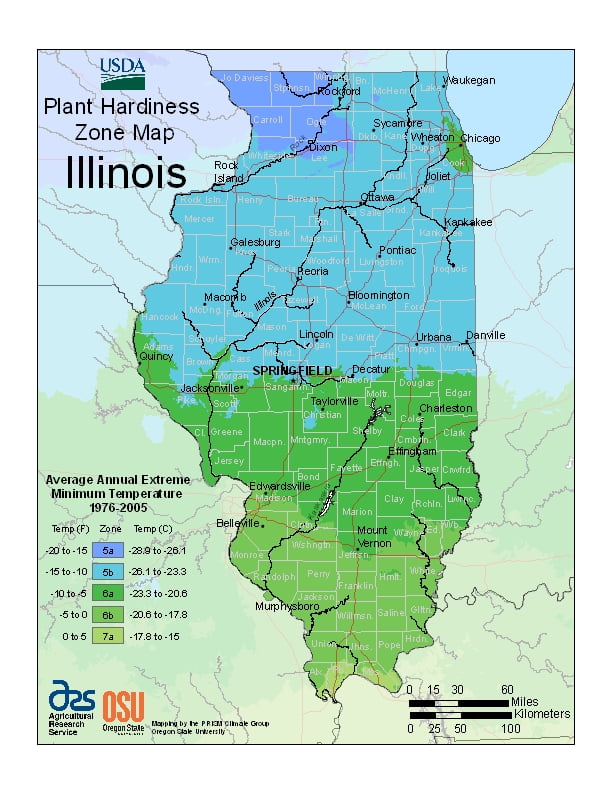
Illinois has a climate that varies widely throughout the year, ranging from USDA Plant Hardiness Zones 5a through 7a. Temperatures can vary per different areas of the state so get to know which zone your city is located in so that you can address and avoid potential issues before they become problematic.
The USDA zones map is a useful system for determining what plants will survive and grow in certain areas of Illinois.
Understanding how these hardiness zones work means you can choose the right planting time, and optimize growing for your climate.
The southern part of the state, from about Carbondale southward, has a humid subtropical climate, with more moderate winters.
Average yearly precipitation for Illinois varies from just over 48 inches (1,219 mm) at the southern tip to around 35 inches (889 mm) in the northern portion of the state.
Normal annual snowfall exceeds 38 inches (965 mm) in the Chicago area, while the southern portion of the state normally receives less than 14 inches (356 mm).
The all-time high temperature was 117 °F (47 °C), recorded on July 14, 1954, at East St. Louis, and the all-time low temperature was −38 °F (−39 °C), recorded on January 31, 2019, during the January 2019 North American cold wave at a weather station near Mount Carroll, and confirmed on March 5, 2019.